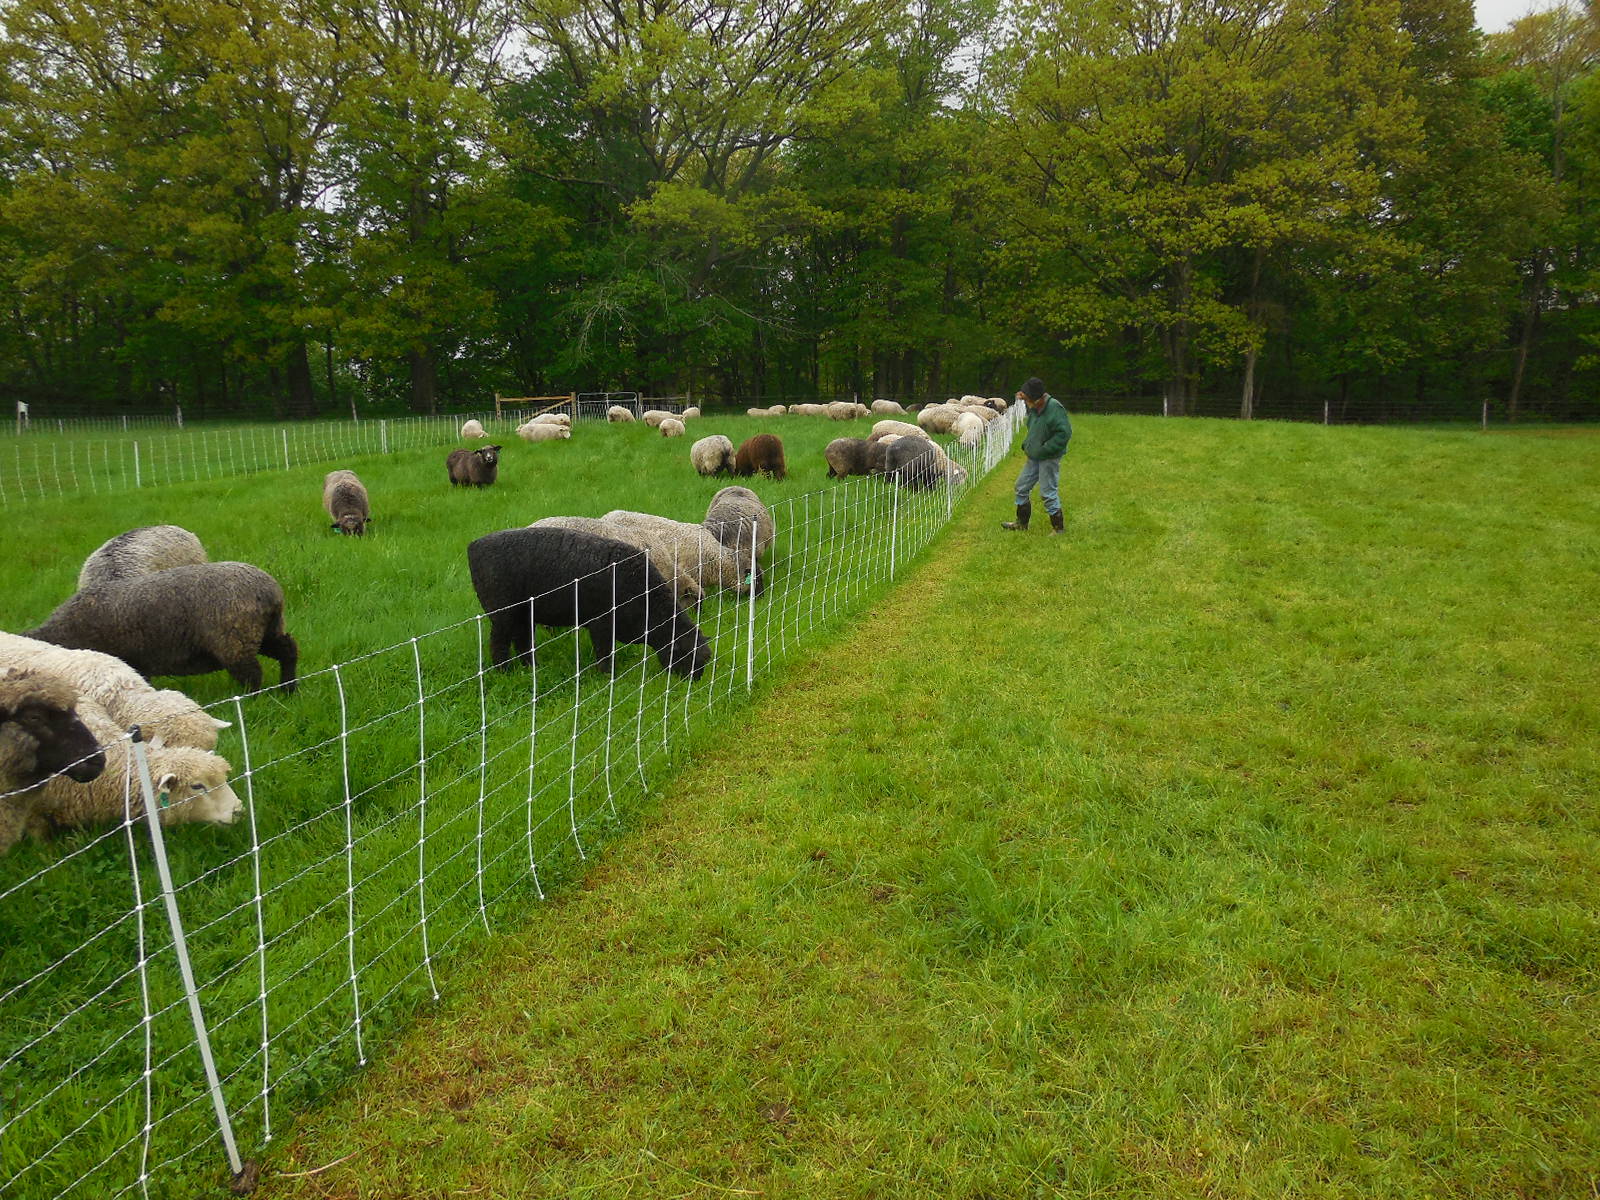
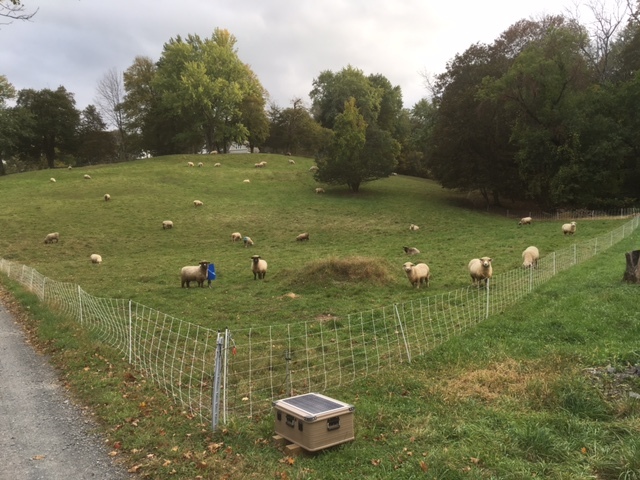
June grazing: photo by Stephen Shafer
Abstract In the world, and in the USA, crop and livestock agriculture accounts for about 10% of total greenhouse gas emissions. In both spheres, fossil fuel combustion (FFC) is usually tagged with only 9-12% of agricultural GHG releases. Ag-related sources not tabulated as “agriculture” when so treated raise that proportion in America from 9% to > 19%. Still, in the USA, nitrous oxide and methane far outweigh carbon dioxide from FFC in the carbon footprint of agriculture. Suppose fossil fuel combustion could by a miracle be banished from agriculture, lowering GHG releases by 120 M mt CO2-e/yr. That would not make as much improvement to global warming as agriculture could effect by lowering emissions by 60 M mt CO2-e/yr and simultaneously sequestering much more than 120 M mt CO2-e/yr in soil through low-tech methods that ease off on fossil fuels, reduce nitrogen needs and improve food security.
Introduction The first essay of this series on “carbon farming” covered greenhouse gases (GHGs) and carbon footprints. In the immediate future every sector of the American and of the world economy must try strenuously in good faith to lower its “carbon footprint.” To see how American agriculture will do our part it helps to profile GHG emissions in that sector. first compared to those of the world, then homing in on the USA.
GHG by economic sector, whole world In the whole world the agriculture sector (in Graph 1 called Ag & land use and in the source document called Agriculture Forestry and Other Land Use or AFOLU) accounted as of 2010 for about 11.8 billion metric tons (Gt)/yr of CO2-equivalents, 24% of the global total. “Crop and livestock agriculture” by itself, however, accounted for only 6 Gt CO2-e, ~ 12% of the global total of 49 billion from all sectors.
Graph 2. 1 GHG releases 2010 whole world by economic sector in billions of metric tons CO2-equivalents (Gt CO2-e) Source https://www.epa.gov/ghgemissions/global-greenhouse-gas-emissions-data/
Note: I made some minor changes of the values for residential and commercial, but their sum is not changed.
GHG by economic sector USA In the USA, the agriculture sector (i.e. crop and livestock) accounts for only 8.4% (566 mt CO2-e/6740 mt CO2-e) of GHG, less than the 12% that characterizes the world (Graph 2.1, above). Source is the interactive tool on page one of this epa document
As carbon pricing strategies would hit agriculture with rising prices for motor fuels, I decided to count in fossil fuel combustion in farm-operated vehicles doing farm work off the farm. [ For methods click on the prompt to "Read More" at end of text. ] The modified distribution is depicted in Graph 2.4 . The ag sector thus added-to now accounts for 9.4% of the country’s GHG.
Graph 2.4 Greenhouse gas emissions (GHG) in million metric tons (M mt) by economic sector, USA 2014, agricultural* and transportation* sectors modified to put off farm fossil fuel combustion into “agriculture.” original data from 2017 EPA web site
Sources of GHG releases in world agriculture
Graph 2. 5 World greenhouse gas releases in crop and livestock agriculture 2010, by source Note: figures recalculated from FAO document . Abbreviations “ferment”= fermentation “mgt” = management; “Syn fert N” = synthetic fertilizer nitrogen; “fossil fuel” = fossil fuel combustion in agricultural machinery. Note savannah burning may belong to “Forestry and other land use” rather than crop and livestock, but I left it in. Total releases 6.31 billion metric tons.
The striking feature of the world picture (Graph 2. 5, above) is that about 71% of GHG, in CO2-e, is methane (CH4) from animals and paddy rice. Only 13% is from synthetic fertilizer nitrogen (nitrous oxide = N2O) and only 13% is CO2 from fossil fuel combustion on farms. In the USA, compared to the world , “soil management” (manufacture and application of synthetic nitrogen fertilizers) explains 44% of the national total of CO2-e released. Compare this to 13% in the world (Graph 2.5). Enteric fermentation is the principal (39%) source of GHG from world agriculture. In the USA it ranks second at 29% to soil management. Manure management in the USA is just 15% of the total, less than the 22% characterizing world agriculture. In both the USA (9% by my reckoning) and the world (13%), fossil fuel combustion (FFC) in mobile farm machinery seems a relatively small contributor to agricultural greenhouse gases.
FFC in farm vehicles doing farm business on public roads should be counted, however, when thinking of carbon tax impacts. Unable to find a figure, I had to guesstimate one, as mentioned above, and added 70 M mt/CO2-e/yr. Graph 2.6 shows the new distribution of GHG sources within Agriculture. With this modification, fossil fuel combustion as a GHG source within this economic sector goes up from 9.4% to 19%.
Graph 2.6. GHG emissions by source within Agricultural economic sector USA 2015 not including CO2 emissions from electricity generation or synthetic nitrogen fertilizer manufacture. The national total is 643 M mt CO2-e/yr including 9 M mt CO2-e/yr from urea and liming. Note Figures for columns 1,2, 3 and 5 are from Chapter 5 of a 633-page epa report. Figure in col 5 is estimated by me for OFF farm vehicles (see text) is not from EPA Figure in column 4 for ON farm machinery is for 2014. See reference .
Conclusions Because most people think of CO2 first and of the filling station pump, the biggest impact of a price on carbon that superficial analysis foresees right away would be higher motor fuel prices. These by rights should drive down fossil fuel use and hence CO2 emissions. Today’s farm directly combusts a lot of diesel along with natural gas, heating oil and gasoline. Graph 2.6 shows, however, that even in the mechanized USA fossil fuel combustion as a source of GHG in agriculture is not much compared to “soil management” + {enteric fermentation and manure management}.
These last three GHG sources ( in italics) account jointly for 92% of USA agricultural GHG if fossil fuels burnt off the farm are not counted. Only the first (fossil fuel burning in mobile farm machinery, with its small 9% share ) is an obvious fit into predicting the impact of a carbon tax or fee on farmers. Other uses of fossil fuels, shown in bold above, are ignored. Reckoning the full size of a carbon tax impact on farmers and ranchers, however, means looking beyond motor fuels burnt in the fields to the other ways that fossil fuels, combusted, underlie the resource-use budgets of ranches and farms.
Suppose (and this is impossible near-term) American agriculture ended all fossil fuel combustion, direct and indirect that I have brought in so far. Reductions in GHG emissions would be relatively small, maybe 19% of of 643 M mt CO2-e/yr = 128 M mt CO2-e/yr. The consequences, absent new carbon-neutral energy sources, would be awful: farms idled, harvests shrunken. There is, fortunately, another way than rapidly ditching fossil fuel combustion for American farmers and ranchers to combat global warming and at the same time improve our own lot and that of everyone who eats: carbon sequestration in soil and trees.
The third, next, essay of this series, “Fossil Fuels in the Carbon Footprint of American Ag,” continues the theme that fossil fuel combustion related to agriculture must be lowered in the near future but is not by itself the key to how farming can help solve global warming and maintain food security. It will also address other sources of fossil fuel combustion related to agriculture that have not come up so far, including electricity generation and power for the manufacture of synthetic nitrogen fertilizers.
End of text click here to go to appendix
Appendix on adding a figure made up by me for fossil fuel combustion in farm vehicles off the farm
Using data from Chapter 5 of a 633-page epa report I moved 70 M mt CO2-e/year of transportation into agriculture to account [very very roughly] for GHG releases from fossil fuel combustion in farm-owned vehicles doing farm business on public roads. The national total, excluding territories, remains 6703 M mt. CO2-e/yr. The 70 M mt figure assumes that about one fifth of CO2-e emissions from light duty trucks are attributable to such public-road farm activity (e.g. hauling livestock, delivering hay). In 2014, CO2-e emissions from light duty trucks were 338 Mmt. See page two of this reference. The redistributed figures are shown in Graph 2.4 .
Graph 2.4 USA GHG for 2014. by source, modified slightly from figures on an EPA web site . Figure in col 5 is estimated by me for OFF farm vehicles (see text) is not from EPA Figure in column 4 for ON farm machinery is for 2014, See reference . CO2 emissions from urea and liming (9 M mt/yr) omitted for graphic simplicity. Total including the 9 is 643 M mt Co2-e/yr.
Appendix 2 The volume of GHG releases from fossil fuel combustion in mobile equipment on farms is not small compared to other sectors of transportation, being slightly more than rail and than a surprising entrant, pipelines. [I think it’s the compressor stations for natural gas pipelines that generate most of the emissions in that category]
Supplementary Materials
The excellent paper by Vermeulen et al [Vermeulen Sonja J, Bruce M Campbell, John S. I. Ingram Climate Change and Food Systems Annual Review Environment and Resources 2012; 37: 195-222 ] places agriculture within food systems states. The boundary is soft. “food systems” contributed in 2008 between 9.8 Gt and 16.9 Gt CO2-e , or 19 to 29% of global anthropogenic greenhouse gas emissions. “Food systems” include
Pre-production with three sub-categories
A. fertilizer manufacture
B. animal feed production
C. pesticide production
Production (two sub-categories)
A. direct emissions from agriculture in range of 5 to 6 Gt/yr in 2005
B. indirect emissions from agriculture, wide range of 2 to 6.6 Gt [Indirect emissions from land use dominate emissions in developing countries but are almost nil in US and Canada and in China. See figure 2 of Vermeulen]
Post-production( six subcategories)
A. primary and secondary processing
B. storage, packaging and transport
C. refrigeration
D. retail activities
E. catering and domestic food management
F. waste disposal
I believe the authors consider the pre-production and production stages to be “agriculture. They write “The post-production stages of the food chain collectively emit GHG emissions equal to the production stages in high-income countries (Figure 1), although in middle-income and low-income countries, and hence globally, agriculture is by far the dominant source of emissions. (Table 1) Indirect and direct emissions from agriculture differ markedly in their contribution by region (Figure 2).”
<end of Vermuelen sidebar>
